The transition towards private electric mobility has been already started across the world, pushed forward by the need of independence from fossil fuels and of preserving good levels of air quality in urban centers, where vehicular traffic is mostly responsible for air and noise pollution.
Despite the fact that the cost of electric vehicles is still not affordable to the vast majority of population, their prices are supposed to lower in the next year thus leading to a increase of their presence within the cities. In this context it is necessary to provide instruments in order to foresee the effects that such massive introduction might have on the urban environments in terms of amount of electricity and infrastructures needed to their functioning.
E-Mobility aims at being this tool, exploiting a data-driven approach combining different data sources: demographics data, GPS data about cars travelling within an area, environmental data (e.g. solar radiation in order to provide solar energy to recharge station) and so on.
The data is not just visualized but it is the core on which several scenario simulation models are built and merged together. These are:
Synthetic Trajectories Generator
A markovian-model capable of producing synthetic trajectories similar to those performed by real car-drivers during their daily activities. This model is tuned on the GPS data and it is crucial in order to produce a large sample of realistic trajectories performed by car drivers.
Recharge Behavior Model
An Agent-Based Model describing the behavior of electric car drivers whenever they face the need of recharging their vehicle at home or in recharge columns deployed across the city.
Battery Consumption Models
Models of energy consumption of the batteries of electric vehicles based on different vehicle models and depending on the speed, travelled space and temperature of the environment in which the car is moving.
Park’n’Ride Model
A machine learning-based model quantifying the amount of drivers willing to leave their cars in specific areas and then continuing their journey with public transport.
Researchers Involved
Bernardo Monechi (Sony CSL)
Vittorio Loreto (Sony CSL)
External Researchers Involved
Carlo Liberto (ENEA)
Gaetano Valenti (ENEA)
Indaco Biazzo (Politecnico of Turin,
http://www.indacobiazzo.me/)
Marialisa Nigro (University of Roma 3)
Bruno Campanelli (Sapienza University of Rome)
Partnership
Riccardo Corradi (I-Lab,
http://www.ilabroma.com/)
Danilo Guidi (I-Lab,
http://www.ilabroma.com/)
Stefano Guarino (I-Lab,
http://www.ilabroma.com/)
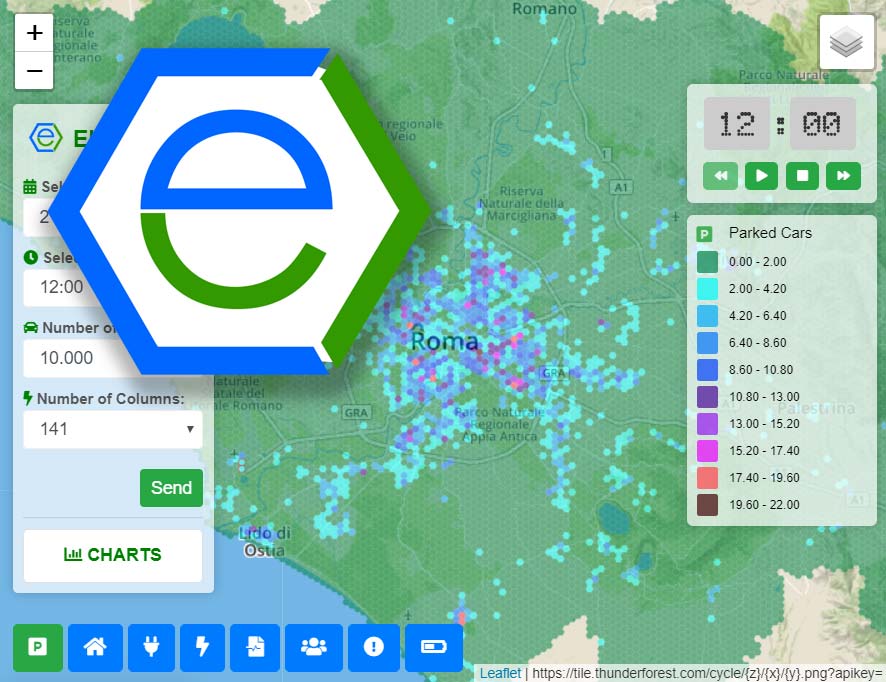
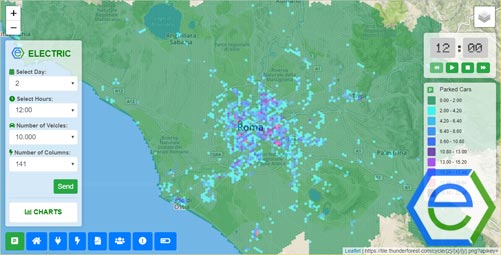
The Interface
The interface of E-Mobility allows to explore several results coming from the simulations performed with the underlying models. In the current version it is possible to vary the number of electric vehicles present in the Metropolitan Area of Rome and the number of public recharge areas, exploring various aggregate output quantities:
 Parked Cars:
total number of electric vehicles that are parked in a given area at a given time
 Home Charging:
total number of electric vehicles that are charging using the household electrical system.
 Charging:
total number of electric vehicles that are charging using public recharge columns.
 Columns:
number of recharge columns present in an area.
 Required Power:
amount of Kw required to the power grid by the household consumption of electricity, plus the consumptions of home charging vehicles and recharge stations. This quantity is compared with the maximum amount of electricity that can be provided in an area. If overcome, the corresponding area is highlighted on the map.
 Missed Charges:
percentage of time a driver wanted to recharge its vehicles but could not due to the lack of infrastructures.
 Population:
distribution of the inhabitants of the city
 Household Consumption:
consumption of electricity required by the presence of household in an area. This is some sort of baseline consumption on which the effect due to electric vehicles is added.
E-Mobility provides additional graphs displaying the overall fraction of missed charges in each hour of the day as well as the amount of electricity missing in the system that is needed to cope with the new demand produced by electric vehicles. Link to technical details Link to the platform