CityChrone++ is one of the instantiation of a larger platform dubbed whatif-machine (link to whatif.caslparis.com), aimed at providing users with tools to assess the status of our urban and inter-urban spaces and conceive new solutions and new scenarios. CityChrone++ focuses specifically on urban human mobility. Human mobility in cities is driven by several factors, featuring a complex interplay between socio-economic conditions, personal inclinations and needs, the urban environment itself and the status of the transportation systems. Individuals may change their behavior depending on the particular time of the day, on which activities they have to perform, and on the quality of the transportation system itself (is it fast? reliable? subject to large disruptions?). On the other hand individual inclinations to adopt public transportation vs. private vehicles might have a tremendous impact on the future of urban environments. It is thus necessary a better understanding of the behavior of individuals during their daily trips, what drives their choices and which statistical patterns are related to them. CityChrone++ is developed by Sony CSL Paris and it is the evolution of an earlier project (available at
http://project.citychrone.org/) developed in collaboration between Sapienza University of Rome and ISI Foundation in Turin in the framework of several research projects.
Researchers Involved
Bernardo Monechi (Sony CSL)
Matteo Bruno (Sony CSL Rome)
Hygor Piaget Monteiro Melo (Sony CSL Rome)
Vittorio Loreto (Sony CSL)
Collaborators
Indaco Biazzo (Politecnico of Turin,
http://www.indacobiazzo.me/)
Bruno Campanelli (Sapienza University of Rome)
Partnership
Riccardo Corradi (I-Lab,
http://www.ilabroma.com/)
Danilo Guidi (I-Lab,
http://www.ilabroma.com/)
Breathing City
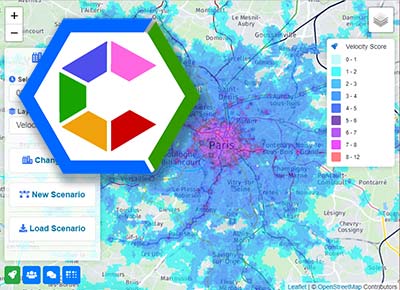
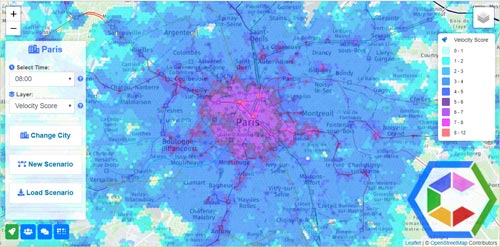
Accessibility in a city depends on the specific time of the day. Here you can appreciate this effect by looking at how the map of velocity scores changes with the specific time of the day which it refers to.
For each time window, each hexagon is colored according to the average velocity to reach it from any other point of the city during that specific time window. The overall effect is what we call a
"breathing city", i.e., a city whose mobility patterns change during the day with quasi-circadian rhythms.
Accessibility Measures in CityChrone++
By the end of this century, most of the world population will be living in cities. The unprecedented level of urban interactions and interconnectedness represents a big challenge to manage the unavoidable growth while aiming at sustainability and inclusiveness. In this scenario, understanding and quantifying this level of interconnectedness seems to be crucial for the development of tackling present and future societal challenges such as social inclusion, segregation and general livability in urban environments. "Accessibility", i.e. the capacity of cities to allow people to move efficiently by guaranteeing equity and equal access to personal and professional opportunities, is then a key concept that is useful not only to decision makers but also to the general public. CityChrone++ aims at providing this information to the vastest audience focusing on the accessibility related with public transport, which is the backbone of the functioning of every city. The scientific background of this project can be found in detail here [2]. In the following we will review the main concepts that have been included in the platform.
Isochrones
The core concept of this platform is that of isochrones, i.e. the set of locations that can be reached in the same amount of time starting from the same point. Isochrones are calculated using Google GTFS data [1] about public transport in each city of the platform, and up-to-date routing algorithms capable of finding the optimal path (i.e. the one requiring the least amount of time to be performed) while navigating the city using public transport [2]. Isochrones can be explored for each city on the platform by clicking on different parts of the map.
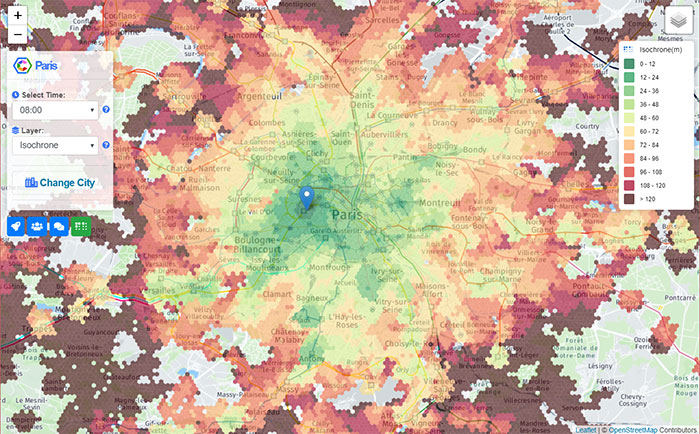
Example of the visualization of the isochrones on the platform. Different colors represents different travel times starting from the points on which we have clicked.
Velocity Score
Isochrones are an interesting concept when trying to quantify the functioning of public transport in a certain location. However, it is complicated to confront all the isochrones for different locations within the same city. The
Velocity Score is a metrics that can be computed for each point on the map starting from the concept of isochrones, that quantifies
how fast it is possible to move away from an area using public transport. In other words, the Velocity Score aggregates the information of the all the isochrones starting from the same point, providing of a general score about the quality of public transport in any given location.
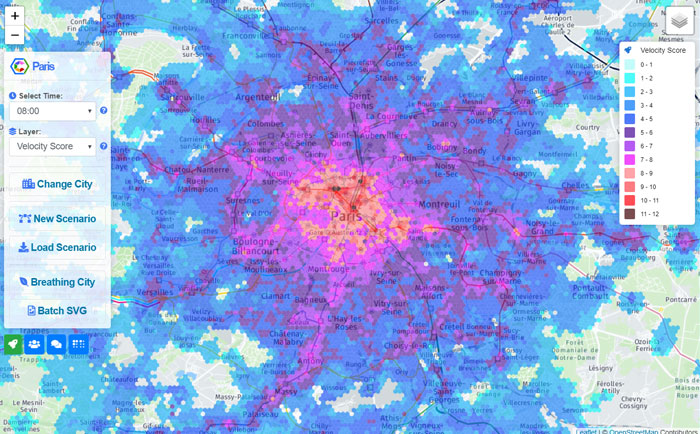
As a final results, we have a map allowing for a quick comparison of the quality of public transport across different areas of a city.
Sociality Score
An important aspect of public transport is that one of its main purposes is to allow people to be connected with one another and to foster the interactions between the inhabitants of the city. Similarly to the Velocity Score, the
Sociality Score exploit the concept of isochrones plus the distribution of the population within the city to quantify the number of people that could be potentially reached from a given location using public transport.
The Sociality Score adds new information to the picture, allowing for a deeper understanding of the relation between the inhabitants of the city and the public transport system.
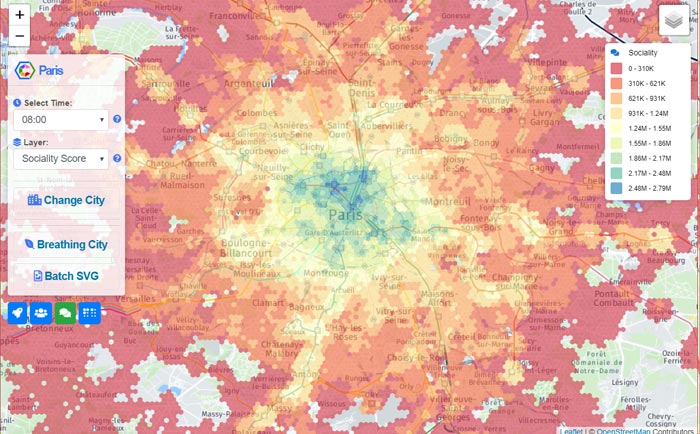
Similarly to the Velocity Score, the Sociality Score can be compared by visualizing it for different parts of the same city.
City Rankings
Both the Velocity Score and Sociality Score can be used to compare areas within a city. Averaging these quantities between all the areas of each city allows to have aggregated scores in order to compare the goodness of public transport services along the world. This aggregated scores can be used to build
Rankings of cities, similarly to what it is usually done with macro-economic indicators as GDP, Net Exports etc.
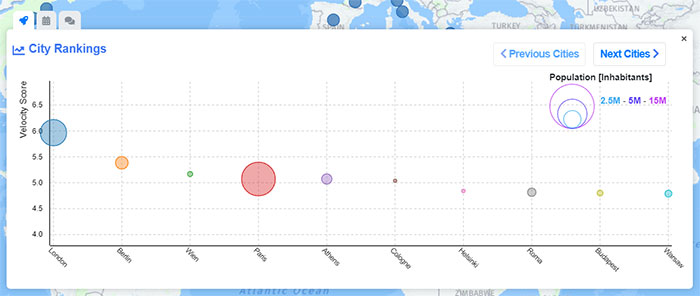
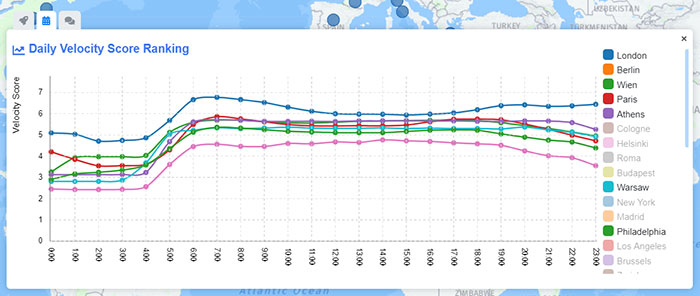
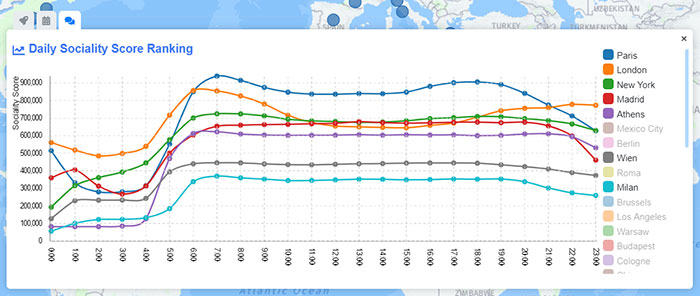
These rankings can be navigated in the main page of Citychrone++. It also is possible to compare the position in the ranking of each city at different hours of the day.
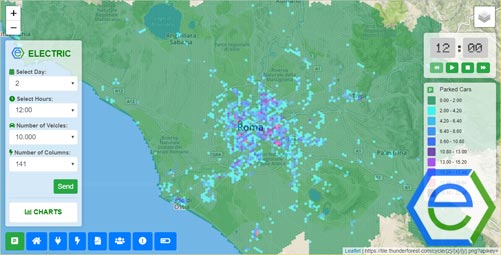
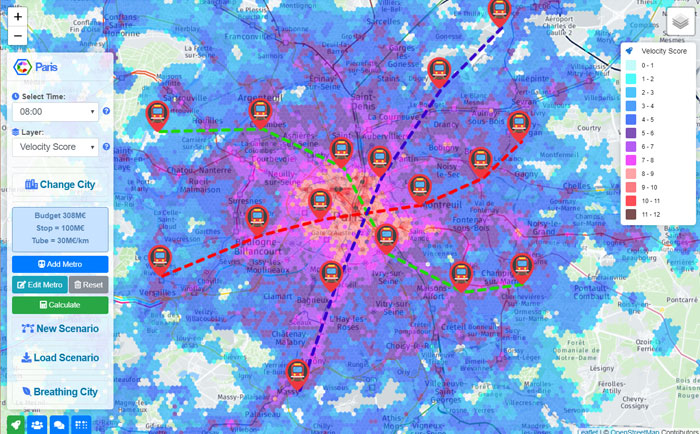
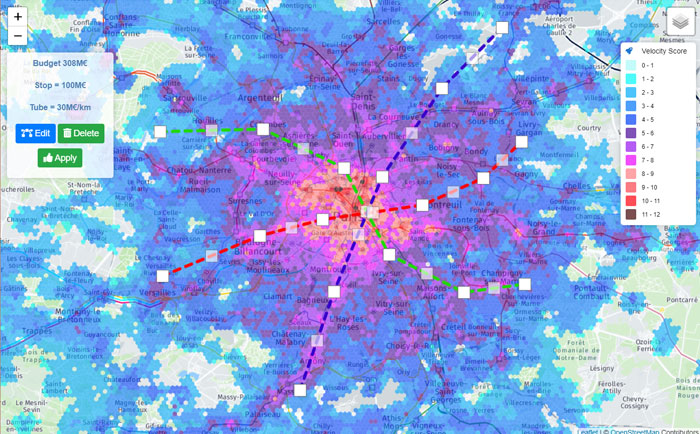
Exploration of Scenarios
Citychrone++ allows also to explore ways in which the current situation of public transport can be improved. Within each city, it is possible to add metro lines with a fixed budget and then recompute all the isochrones and accessibility metrics. In this way, it is possible to have a precise quantification of the effects of the introduced changes, exploring the space of possible solution in search of the better one.
Go to CityChrone++
[1]
https://it.wikipedia.org/wiki/General_Transit_Feed_Specification
[2]
https://arxiv.org/pdf/1810.03017.pdf